Best time to go to Petra (Pla de Mallorca) Average weather of Petra (Pla de Mallorca), Majorca
When is the best time to go to Petra (Pla de Mallorca)?
When is the best time to go to Petra (Pla de Mallorca)? Here's some information to help you in your decision:
- The best months for good weather in Petra (Pla de Mallorca) are March, April, May, June, July, August, September, October, November and December
- On average, the warmest months are July, August and September
- July is the driest month
- The coldest months are January, February and March
Annual weather in Petra (Pla de Mallorca)
To get all the information about the climate and weather in Petra (Pla de Mallorca) for a specific month, scroll down below the table and choose a month from the tabs.
| Month | Our opinion | |||
|---|---|---|---|---|
| January | 54°F/59°F | tolerable weather | ||
| February | 54°F/59°F | tolerable weather | ||
| March | 56°F/61°F | good weather | ||
| April | 59°F/65°F | good weather | ||
| May | 65°F/70°F | perfect weather | ||
| June | 72°F/77°F | perfect weather | ||
| July | 77°F/83°F | perfect weather | ||
| August | 77°F/83°F | perfect weather | ||
| September | 74°F/79°F | perfect weather | ||
| October | 68°F/74°F | perfect weather | ||
| November | 61°F/67°F | good weather | ||
| December | 58°F/61°F | good weather |

Weather detail month by month in Petra (Pla de Mallorca)

Weather and climate in Petra (Pla de Mallorca)
Petra (Pla de Mallorca) enjoys a hot-summer Mediterranean climate in accordance with the Köppen-Geiger classification. The yearly average maximum temperature in Petra (Pla de Mallorca) is 70°F (ranging from 59°F in february to 83°F in august). Annual rainfall is 13.3in, with a minimum of 0.2in in july and a maximum of 2in in november.
- Between the months of january and february the climate is not good, but still OK. At lunchtime, it's 58°F in average and, in february, 2 days of rain are expected.
- From march to april the climate is favorable. By early evening, the temperature averages 61°F and it rains about 6% of the time in april.
- Between the months of may and october the climate is very good. The record temperature this month is 83°F and you can expect to have 1.5in of rainfall/month during this period.
- Between the months of november and december the climate is favorable. In average, on the morning it is 58°F and it rains about 1.2in each month.
Charts: temperature and rainfall in Petra (Pla de Mallorca)
In the charts below, you can see the following seasonal norms for the city of Petra (Pla de Mallorca): the minimum and maximum outdoor temperature, the risk and amount of monthly rainfall, daily average sunshine, and relative humidity for each month of the year.
Outside temperature
Precipitation (rainfall)
Daily sunshine hours
Humidity
Other cities and places near Petra (Pla de Mallorca)


Chargement en cours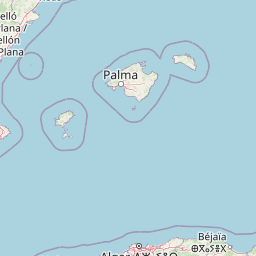


Leaflet | © OpenStreetMap contributors
Legend:
 Petra (Pla de Mallorca)
 other locations
Petra (Pla de Mallorca)
other locations